
A bit of CALCULUS!

|
Ever since the first Murderous Maths book came out in 1997, we've had messages asking when we're going to explain calculus.
Eventually in 2008, Kjartan Poskitt wrote Easy Questions Evil Answers which had a chapter that included calculus. Unfortunately this chapter was thought to be so complicated, that the police confiscated it and locked it away in case it melted anybody's brains.
However our brave fearless Pure Mathematicians are not scared of having their brains melted and they were determined to hunt it down!
|
So now we can finally bring you the EASIEST QUESTION with the EVILLEST ANSWER!
The easy question turned up in a letter we received from Odd Street Primary School:
|
Dear Murderous Maths,
We have a square plastic sheet measuring 10 metres along each side.
We want to fold it to make a water tank with a square bottom.
What is the most water it can hold?
Yours sincerely,
Mrs Twelvetrees (head teacher)
P.S. No cutting allowed or you’ll have to stand out in the corridor and miss story time.
|
The question seems easy enough doesn't it?
But to find the answer we're going to have to use GRAPHS then GRADIENTS then ALGEBRA then finally CALCULUS!
|
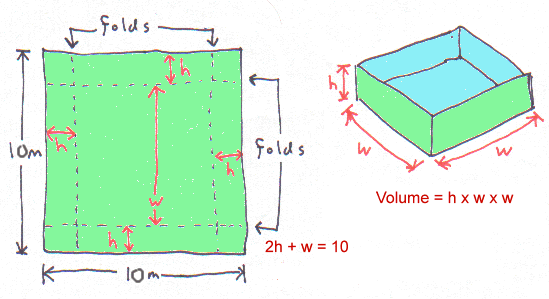
To make the tank, they need to start with the square sheet laid out flat, and then they fold the edges up to make the sides.
The volume of the tank tells you how much water it can hold, and it all depends on how wide we make the bottom.
For example, suppose the bottom is 8 metres wide, the height will be 1 metre and the volume will be
1 × 8 × 8 = 64 cubic metres.
| 
|
|
Here are some different shapes of tank we could make with the plastic sheet.
Out of these four tanks, the one with the biggest volume is 6 metres wide and it holds 72 cubic metres.
| 
|
We thought this was a good answer, so we sent it off to Mrs Twelvetrees.
This is the letter we got back:
|
Dear Murderous Maths,
How do you know this is the MOST water it can hold? You haven't tested all the possible measurements. Suppose the tank was 7 metres wide? Or 6.37 metres wide?
Yours unimpressedly,
Mrs Twelvetrees (head teacher)
|
|
|
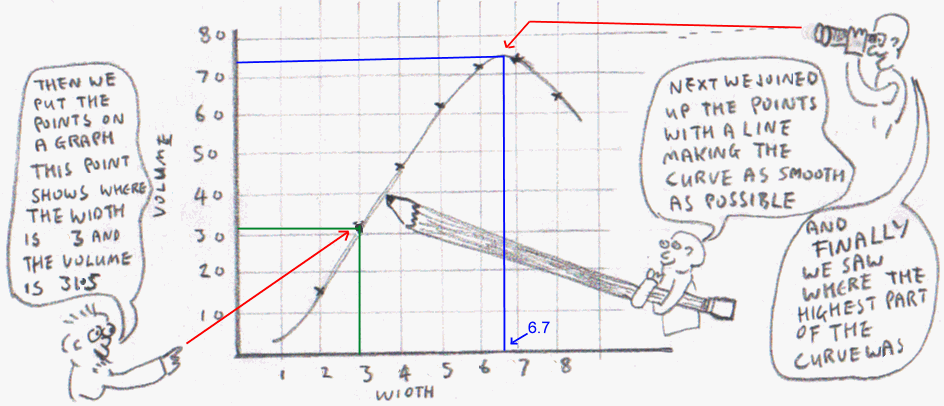
The simplest way to test ALL the possible measurements is to draw a graph.
| 
|
|
|
The highest part of the curve shows the highest volume. It seems to be where the width is about 6.7 so let’s work out what volume this width would give us. We need the two equations from our first diagram:
volume = h × w × w
w + 2h = 10
|
|
First we’ll work out the height h so we’ll use the second equation and put in
w= 6.7
6.7 + 2h = 10
This becomes: 2h = 10 - 6.7 = 3.3
And finally: h = 3.3 ÷ 2 = 1.65
|
|
Now we can use the volume formula. We get:
Volume = 1.65 × 6.7 × 6.7
= 74.0685 cubic metres.
Hooray! That’s the biggest volume we’ve managed to find so far, so it works.
|
But that still wasn't good enough for Mrs Twelvetrees!
|
Dear Murderous Maths,
You still haven't worked it out EXACTLY!
All you've done is drawn a curved line. How do we know that you've drawn it absolutely perfectly? In fact some of your drawings on this page look a bit rough. (There's a very nice one of me though.)
If you can't do better, we're going to start reading Horrible Science books instead of yours.
Yours crossly,
Mrs Twelvetrees (head teacher)
|
|
|
 Mrs Twelvetrees
|

Eeeek!
At this point we had no choice. We HAD to use CALCULUS!
 To understand calculus, we have to go back to the 1660's when people like Isaac Newton were discovering how gravity worked.
Isaac had started to realise that gravity controlled how the planets moved around the sun, but he wanted to prove it. This involved knowing the exact paths the planets took, but the trouble was that planets move in elliptical orbits.
Isaac needed an accurate way to calculate what was going on, so to help him out we'll bring in a very clever French bloke called Rene Descartes.

Descartes had invented his Cartesian Co-ordinate System which starts with two “axes”, in other words a vertical line and a horizontal line.
|
It's like a graph, but you can put algebra equations on it.
We’ve labelled the axes x and y here, but they can be anything you like.
On this graph we’ve drawn two lines that show different algebra equations.
Try picking any point you like on the line labelled
y = x + 1 and you’ll find the x and y values fit the equation. We’ve shown the point where y = 3 and x =2 so if you put them into the equation you get 3 = 2 + 1. It works!
Our other line shows y = 4 – 2x and the point we’ve picked is x = 2.5 and y = -1.
| 
|
|
If you want to find out more about algebra and equations and how it all fits on graphs, it's explained in...

|
If your equation just has a plain x in it, then you will always get a straight line. Things get a bit more exciting when you get x2 or even x3.
|
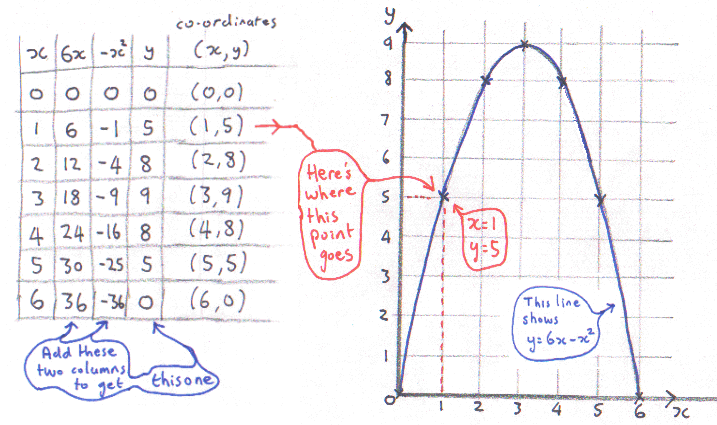
Let’s see what happens with y = 6x – x2
The way to draw these graphs is make a table. Choose some numbers for x, then work out what y is for each one.
It helps to have some extra columns to show the different terms in the equation, then you can just combine them at the end to make y.
You end up with a set of co-ordinates that you can put on your graph and then join them up with a nice curve.
| 
|
|
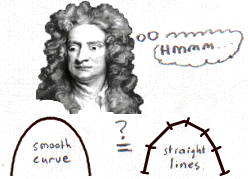
Isaac realised that a smooth curve could be replaced with lots of little straight lines. The smaller the lines were, the more they resembled the curve.
The question was, how could he describe the exact direction that each little line was pointing in? The answer was that he needed to work out the gradient of the line – in other words how steep it was.
|
|
|
GRADIENTS:
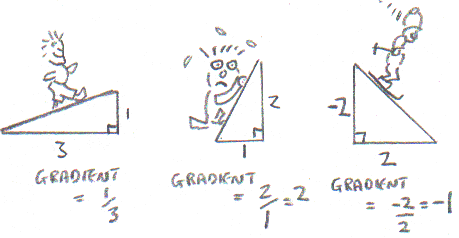
Suppose you have a path going up a slope. You work out the gradient by dividing how far you go up by how far you go along.
You’ll notice that when the slope goes downhill, the gradient is negative! If a gradient is 0 then the path is flat.
|
|
|
Using gradients such as ¼ or 5/3 or –3/2 you can describe exactly which way a line is pointing.
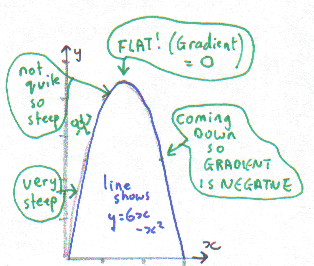
Look at the line for y = 6x – x2 and pretend it’s a hill that you have to walk over. As you go along, the gradient is always changing. It starts very steep in the corner where x = 0. By the time it gets to the top it flattens off, and then it goes downhill, so the gradient becomes negative.
|
|
Isaac invented a method called Differential Calculus.
It divides the curve into an INFINITE NUMBER of teeny weeny little lines, and then lets you calculate the gradient of any teeny weeny little line you like!
|

|
At this point we should mention that a German called Gottfried Leibniz also claims to have invented calculus at about the same time. The trouble is that Isaac was very secretive and so nobody knows for sure who was first! One of them might even have stolen it off the other, but we don't know. To be fair to Gottfried, Isaac actually called his method "fluxions" and he wrote it without the dy/dx bit that we have come to know and love.
 If you want to find out more about Isaac, calculus, gravity, prisms, apples and everybody he argued with (and there were a LOT of them!), it's all in Newton and His Falling Apple.
|
|
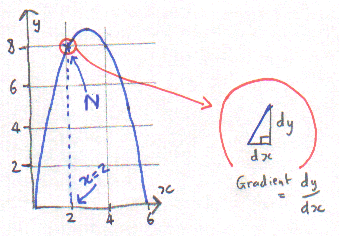
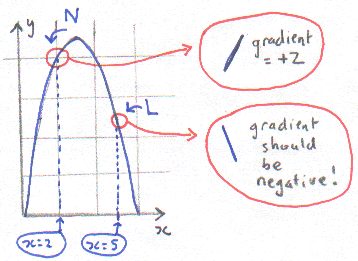
We’re going to work out the gradient of the teeny weeny little line marked N where x = 2.
It goes up in the y direction a teeny weeny little bit. In maths the letter d means teeny weeny, so we can call the amount it goes up dy. It also goes along the x direction a teeny weeny bit so we call this dx. We can now say:
Gradient = dy/dx .
Therefore we now need a formula for dy/dx.
|
|
To get a formula for dy/dx we are going to take our equation for the line (which is y = 6x – x2 in case you forgot) and we are going to...
differentiate it!
|
 How to DIFFERENTIATE an equation!
1/ Multiply each term by the power of x
2/ Divide the term by x
|
If you want these instructions
in a nice little formula:
If ... y = axb
then ... dy/dx = bax(b-1)
|
|
|
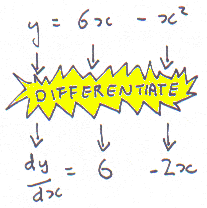
Our equation is y = 6x – x2 so first we’ll do the 6x term because that’s easy.
Multiply it by the power of x, but as the power of x is just 1, we just get 6x.
Next we divide the term by x and so we just end up with 6.
Now we’ll do the –x2 term. We multiply it by the power which is 2 and get -2x2 , then we divide it by x and get -2x.
We put our two new terms together and get the result:
dy/dx = 6 – 2x
|
|
|
And now the most important bit.
We pause and have a bit of chocolate cheesecake to celebrate because we’ve just done our very first bit of CALCULUS.
|

|
Now we can get the gradient at point N because we know x = 2.
We put this into our dy/dx = 6 – 2x and get...
dy/dx = 6 – 2 × 2 = 6 – 4 = 2.
The teeny little line at point N has a gradient of 2! This makes sense because it looks quite steep and it’s going uphill.
|
|
How about point L where x = 5?
The curve is coming downhill here so we should get a negative answer, and it’s even steeper than point N, so let’s see what we get if we put in x = 5.
dy/dx = 6 – 2 × 5 = 6 – 10 = -4.
Wow! The “4” means it’s steeper than 2, and yes, it IS negative!
|
|
By the way, we called our points N and L after Newton and Leibniz, so now they can BOTH feel famous and appreciated.
|
WOO-HOO! Now we know about calculus, there's loads of weird stuff we can do. For instance if you're on a journey and plot a graph with time along the bottom and distance travelled up the side, if you differentiate, you can get the speed. And if you double differentiate you get the acceleration at any point!
|
Dear Murderous Maths,
So what about our plastic sheet?
Yours still waitingly,
Mrs Twelvetrees (head teacher)
|
|
Ooops! In all our calculus excitment, we nearly forgot the easy question that started all this.
We need to get those two equations again:
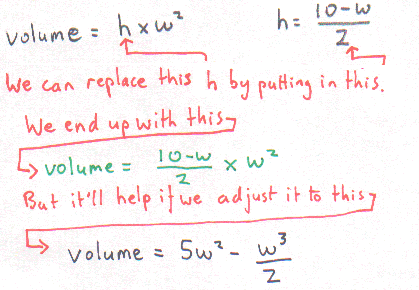
volume = h × w × w which we can write as: v = h × w2
w + 2h = 10 which we can adjust to make: h = (10-w)/2
We'll combine them to get rid of h so we just have v and w.
|
|
|
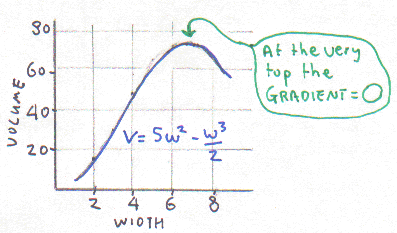
We can draw this equation on a graph with volume up the side and width along the bottom. This might look nasty but in fact we already did it right back at the top of the page! (It's the one with the bloke holding the giant pencil.)
Here’s the same graph again, but smaller and cuter.
We’ve got back to the problem of finding where the top of the curve is, but this time we can find the top of the curve exactly!
|
|
|
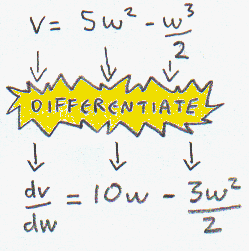
The gradient at the very top (or bottom) of a curve is always zero, so first we’ll use calculus to differentiate the equation to get the gradients for this graph.
|
|
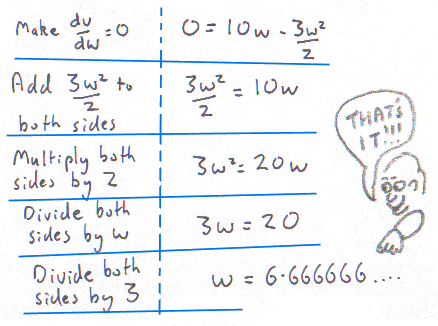
If the gradient is 0 then that means dv/dw = 0. We just put this in and we get an equation to find w.
In case your algebra is a bit dodgy we’ll take you through it gently…
|
|
AT LAST!
For the maximum volume we know that w = 6.6666… and that’s EXACT!
Now we can work out the maximum volume of water you can hold using a square plastic sheet measuring 10m along each side if it's folded into a tank shape with a square bottom.
We just put w=6.6666... into our
v = 5w2 - w3/2 equation.
(Did you want to see the sums? No, we thought not.)
We get the answer: 74.074074 cubic metres .
For that, a little celebration is in order.
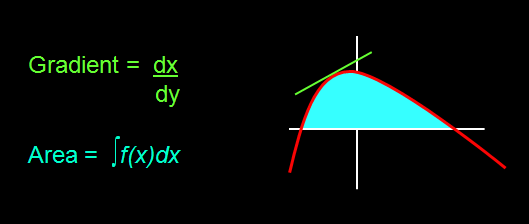
| There's lots more to know about calculus, such as integral calculus which finds the area under a curve, but for now, that's enough.
So if YOU are one of the many people who asked us to explain a bit of calculus - we hope you liked it!
|
 |

Easy Questions Evil Answers
Murderous Maths Main Index Page
Text © Kjartan Poskitt 2008. All enquires to Scholastic Books, Euston House, 24 Eversholt Rd, London NW1 1DB.
Mrs Twelvetrees and Odd Street School images drawn by David Tazzyman in Agatha Parrot and the Floating Head


 Mrs Twelvetrees


 How to DIFFERENTIATE an equation!


